
2027 Market Outlook: Inflation, Federal Reserve policy, and the AI investment cycle
Executive Perspective
As 2026 draws to a close, we are assessing the forces most likely to shape markets in 2027. We believe inflation and the Federal Reserve’s interest-rate decisions will remain central, alongside the rapid expansion of artificial intelligence. These themes are intertwined: the capital spending required to build AI infrastructure could add to near-term demand and inflationary pressure, while productivity gains from AI may ultimately prove disinflationary. For now, the balance between persistent inflation, monetary policy, and economic resilience deserves investors’ closest attention.
The critical question is not simply whether the Fed raises rates once or twice more. It is whether inflation can be contained without materially undermining growth or increasing recession risk. An expanding economy can often absorb measured tightening. Persistent inflation, however, can erode purchasing power, compress valuations, and force the Fed to keep policy restrictive for longer. The scale and duration of inflation may therefore matter more than any single rate decision.
01 | Inflation: The Starting Point
The Federal Reserve targets 2% inflation as measured by the personal consumption expenditures (PCE) price index. Headline Consumer Price Index (“CPI”), while a different measure, offers a useful view of the inflation pressures households experience. The September 2026 headline CPI reading was approximately 3.7% year over year; the average across April–September was also approximately 3.7%, based on the data presented here.
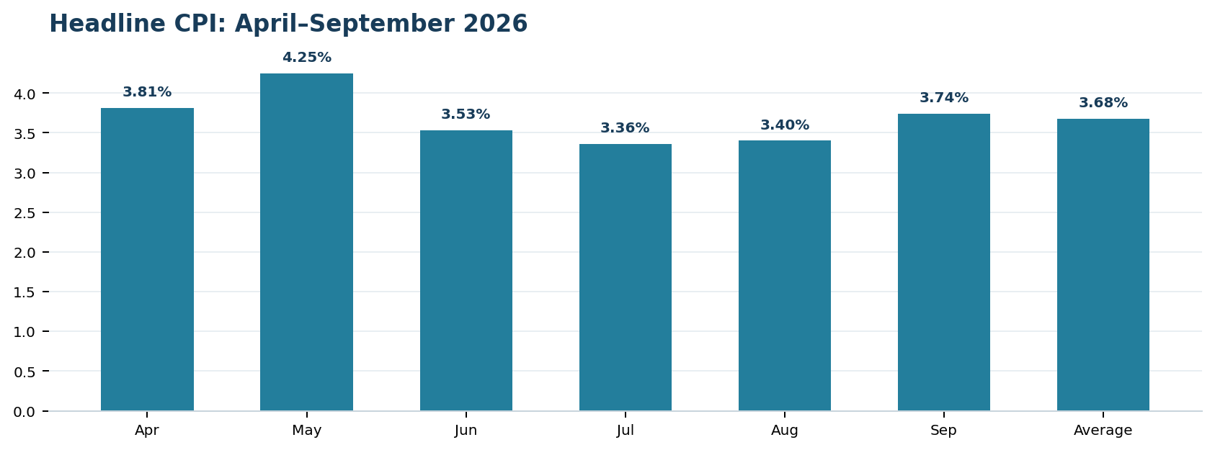
Source: Bureau of Labor Statistics. Figures are year-over-year CPI growth values.
In September 2026, the Fed raised its target range by 25 basis points, its first increase in more than three years. The central uncertainty now is whether inflation proves persistent enough to require additional tightening and, if so, how well the economy can absorb it.
02 | How the Fed Has Responded
To that end, we compared tightening phases dating to February 1994, when the Federal Reserve began announcing its federal funds rate target decisions. These episodes range from isolated, precautionary increases to sustained campaigns totaling several hundred basis points. The current phase remains to be determined.
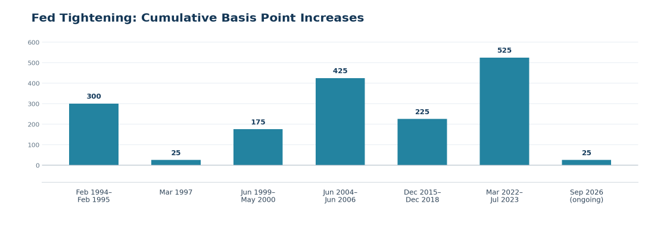
Source: Federal Reserve effective funds rate data from the Federal Reserve Bank of St. Louis.
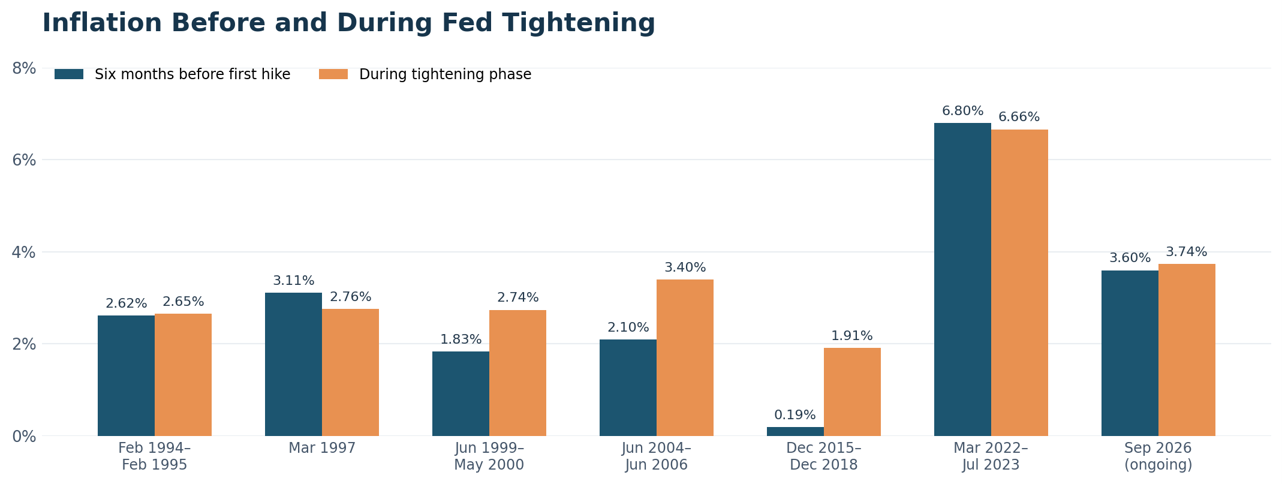
Source: Bureau of Labor Statistics. “6 months before hike” measured as the year-over-year CPI growth in the 6 months prior to the beginning of the period. “During cycle” measured as the year-over-year CPI growth during the period referenced.
The Mar 2022 through July 2023 campaign was the most aggressive in this sample, with 525 basis points of cumulative increases. It also began against an exceptionally high inflation backdrop. Other periods, such as March 1997 and Dec 2015 through 2018, were driven more by expectations of future inflation or the normalization of accommodative policy than by already-elevated headline inflation.
03 | Earnings Resilience Across Tightening Cycles
Corporate earnings are an important counterweight to restrictive policy. In the original analysis, the Mar 2022 through July 2023 phase was the only period with negative average quarterly year-over-year S&P 500 earnings growth. The other phases showed positive growth, although the magnitude and composition varied.
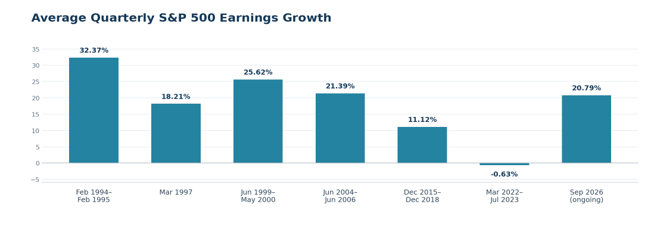
Data from S&P Dow Jones. Feb 1994 – Feb 1995 measures average quarterly year-over-year S&P 500 Index earnings growth from Q1 1994 through Q1 1995. Mar 1997 measures average quarterly year-over-year S&P 500 Index earnings growth for Q1 1997. June 1999 – May 2000 measures average quarterly year-over-year S&P 500 Index earnings growth from Q3 1999 through Q2 2000. June 2004 – June 2006 measures average quarterly year-over-year S&P 500 Index earnings growth from Q3 2004 through Q2 2006. Dec 2015 – Dec 2018 measures average quarterly year-over-year S&P 500 Index earnings growth from Q1 2016 through Q4 2018. Mar 2022 – July 2023 measures average quarterly year-over-year S&P 500 Index earnings growth from Q2 2022 through Q3 2023, Current (Sept 2026 – ?) measures average quarterly year-over-year S&P 500 Index earnings growth from Q3 2026.
The 20.79% earnings-growth figure shown for the current period suggests a materially different corporate backdrop from that of the Mar 2022 through July 2023 period. Nevertheless, one strong quarter does not establish a durable earnings trend, and revisions to index earnings data can affect historical comparisons.
04 | How Equities Performed
Higher rates do not automatically imply negative equity returns. The market response depends on the pace of tightening, the inflation backdrop, earnings growth, valuations, and the underlying economic cycle. We measured S&P 500 total returns over the 12 months following the start of each historical tightening phase.
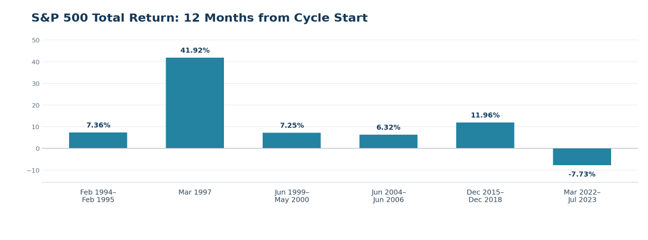
Data from Yahoo Finance. 12-month forward total return of the S&P 500 Index for “Feb 1994 – Feb 1995” was measured from 02/28/94 through 02/28/95, 12-month forward total return of the S&P 500 Index for “Mar 1997” was measured from 03/31/97 through 03/31/98, 12-month forward total return of the S&P 500 Index for “June 1999 – May 2000” was measured from 06/30/99 through 06/30/00, 12-month forward total return of the S&P 500 Index for “June 2004 – June 2006” was measured from 06/30/04 through 06/30/05, 12-month forward total return of the S&P 500 Index for “Dec 2015 – Dec 2018” was measured from 12/31/15 through 12/31/16, 12-month forward total return of the S&P 500 Index for “Mar 2022 – July 2023” was measured from 03/31/22 through 03/31/23.
The Feb 1994 through Feb 1995, June 1999 through May 2000, and June 2004 through June 2006 phases each produced mid-single-digit to high-single-digit forward returns in the analysis. The isolated 1997 hike coincided with particularly strong equity performance during the technology expansion. By contrast, the Mar 2022 through July 2023 phase saw a negative 12-month return as inflation, rapid tightening, and weak earnings converged.
05 | Lessons From the Historical Record
• Feb 1994 – Feb 1995, June 1999 – May 2000, and June 2004 – June 2006: These cycles featured meaningful tightening alongside positive earnings growth. Their subsequent equity returns were relatively modest but positive over the selected 12-month windows. We believe resiliency in earnings growth buoyed against the backdrop of inflationary pressures.
• March 1997: The Fed raised rates only once, acting preemptively against potential inflation. Strong growth and the emerging technology boom coincided with substantial subsequent equity gains.
• Dec 2015 – Dec 2018: The Fed gradually withdrew extraordinary post financial crisis accommodation. This was a normalization cycle, not primarily a response to elevated realized inflation.
• Mar 2022 – July 2023: High realized inflation, unusually rapid tightening, and weaker earnings coincided with the weakest forward equity return in the sample. We believe this was the worst combination of all effects. Without strong earnings growth to help curb the negative effects of inflation and a rising rate cycle, equity performance suffered.
06 | Artha Scenario Analysis
Historical analogues are useful, but they cannot isolate the effects of inflation, interest rates, and earnings. To explore these variables separately, we used Artha’s AI scenario-testing capability to model hypothetical paths for the SPDR S&P 500 ETF (“SPY”). The following exhibits are scenario outputs, not forecasts that should be interpreted as guaranteed or independently additive effects.
Persistent Inflation Scenario
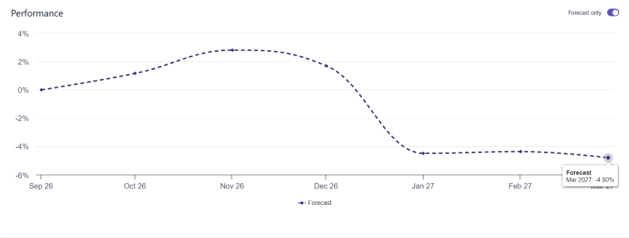
Source: Artha scenario analysis; underlying SPY total-return data from Finnhub. For illustrative purposes only.
Fed Rate Hike Cycle Scenario
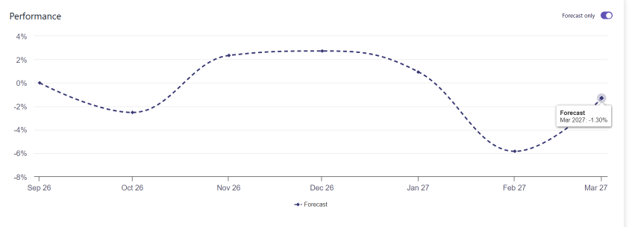
Source: Artha scenario analysis; underlying SPY total-return data from Finnhub. For illustrative purposes only.
Earnings Growth Scenario
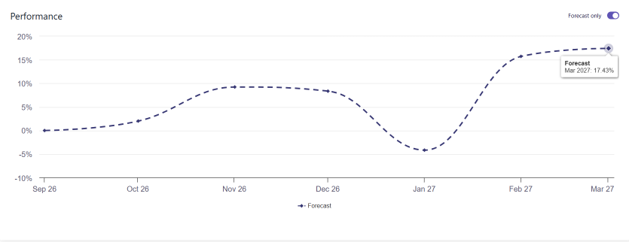
Source: Artha scenario analysis; underlying SPY total-return data from Finnhub. For illustrative purposes only.
As illustrated by the forecasts above, the projected performance under each scenario is broadly consistent with historical trends of the aforementioned cycles. Strong corporate earnings growth can help offset some of the negative effects of inflation and rising interest rates, providing an important source of resilience for equity markets.
Perhaps more importantly, the analysis suggests that while monetary tightening can weigh on equity performance, the impact of persistent inflation may be considerably more pronounced. This helps explain why several historical tightening cycles were accompanied by positive forward equity returns, given that inflation remained relatively contained and corporate earnings were healthy.
07 | Which Historical Period Looks Most Like 2027?
We see elements of both Mar 1997 and the June 2004 through June 2006 tightening period in the current environment. The parallel with Mar 1997 lies in the transformative investment cycle surrounding new technology; the parallel with the June 2004 through June 2006 cycle lies in the possibility of inflation remaining above target while the economy and corporate profits continue to expand.
That said, no historical period is a precise template. Today’s AI capital expenditure, energy-price pressures, government financing needs, interest-rate levels, and corporate balance sheets create a distinct mix of opportunities and risks. Continued earnings growth could help equities absorb moderate additional tightening, but persistent inflation or a material slowdown would challenge that outlook.
08 | Our 2027 Outlook
Our base case is that inflation remains somewhat persistent but gradually becomes more manageable, while corporate earnings retain enough momentum to support equity markets. We expect the Fed could raise rates again, though we believe the path will not be quite as prolonged as the June 2004 through June 2006 period, particularly given the low political appetite for monetary tightening. The AI build-out may ultimately help curb inflationary pressures as efficiencies are gained from their adoption.
Given the above analysis and historical president, we remain constructive on the S&P 500’s 2027 prospects and believe the S&P 500 should experience above average returns in 2027. Our optimism rests less on an assumption that rates must fall and more on the possibility that earnings growth can offset some of the headwinds from inflation and tighter monetary policy. The outlook is fluid, and risks from energy prices, bond yields, corporate credit, and unexpectedly persistent inflation warrant close monitoring.
Disclosure
The S&P 500 (Standard & Poor's 500) is a stock market index tracking the performance of roughly 500 leading U.S. publicly traded companies, representing about 80% of the total U.S. market capitalization.
The Bloomberg US Aggregate Bond Index (often called "the Agg") is a broad-based, market-capitalization-weighted benchmark measuring the performance of the US dollar-denominated, investment-grade, fixed-rate taxable bond market.
The reader should not assume that investment decisions identified and discussed were or will be profitable. Specific investment advice references provided herein are for illustrative purposes only and are not necessarily representative of investments that will be made in the future.
*This document does not constitute advice or a recommendation or offer to sell or a solicitation to deal in any security or financial product. It is provided for information purposes only and on the understanding that the recipient has sufficient knowledge and experience to be able to understand and make their own evaluation of the proposals and services described herein, any risks associated therewith and any related legal, tax, accounting or other material considerations. *
Certain information contained herein has been obtained from third party sources and such information has not been independently verified by Global Beta Advisors (“Global Beta”). No representation, warranty, or undertaking, expressed or implied, is given to the accuracy or completeness of such information by Global Beta or any other person. While such sources are believed to be reliable, Global Beta does not assume any responsibility for the accuracy or completeness of such information. Global Beta does not undertake any obligation to update the information contained herein as of any future date.
Except where otherwise indicated, the information contained in this presentation is based on matters as they exist as of the date of preparation of such material and not as of the date of distribution or any future date. Recipients should not rely on this material in making any future investment decision.
Certain information contained herein constitutes “forward-looking statements,” which can be identified by the use of forward-looking terminology such as “may,” “will,” “should,” “expect,” “anticipate,” “project,” “estimate,” “intend,” “continue,” or “believe,” or the negatives thereof or other variations thereon or comparable terminology. Due to various risks and uncertainties, actual events, results or actual performance may differ materially from those reflected or contemplated in such forward-looking statements. Nothing contained herein may be relied upon as a guarantee, promise, assurance or a representation as to the future.
The results discussed herein are derived from both quantitative and qualitative factors, including historical returns and market conditions and assumptions. The projected results are presented to establish a benchmark for future evaluation of its performance, to provide a measure to assist in assessing the anticipated risk and reward characteristics of an investment to facilitate comparisons with other investments. Any target data or other forecasts contained herein are based upon highly subjective estimates and assumptions about circumstances and events that may not yet have taken place and may never do so. If any of the assumptions used do not prove to be true, results may vary substantially. The projected investment returns are pre-tax and represent possible returns that may be achieved. The projected investment returns are subject to change at any time and are current as of the date hereof only. In any given year, there may be significant variation from these projections, there is no guarantee that they will be able to achieve the projected investment returns in the short term or the long term.
The results contained herein are for illustrative purposes only, do not represent the performance of any Global Beta Advisor’s Artha product or any particular investment, and are not intended to predict or depict future results. Performance does not reflect the deduction of fees or expenses, returns received by an investor would otherwise be lower.